

How to Build an Annual Budget Spreadsheet You Still Use in March
Budget spreadsheets do not get abandoned because the formulas break. They get abandoned during setup. This is how a file survives a full year: three layers, 13 tabs, ten minutes a month. No motivation talk, just column names.

Disclosure: The method described here is the structure of an annual budget spreadsheet made by HerRescueKits. It is sold on Etsy and covered here as part of a collaboration with Luna Intim. The system can be built without buying anything, and the section below explains how. This article is an organisational guide, not financial advice.
Quick Answer
An annual budget spreadsheet has three layers: a one-time setup, a monthly loop and a yearly view. Setup holds your currency, categories and recurring bills. The monthly loop keeps planned and actual side by side. The yearly view puts all 12 months on one screen. Keeping the tab count under 15 is what decides whether the file is still open in March.
Key points:
- Budget spreadsheets get abandoned during setup, not because the formulas fail
- A file that arrives pre-filled cuts the first session from 40 minutes to about 5
- In zero-based budgeting the target is not saving more, it is getting left-to-allocate to 0
- Your statement cycle is not the calendar month, and that misplaces spending by weeks
Best for: Anyone who has started a budget spreadsheet more than once and wants this one to survive past February
Downloaded in January, Closed in February
I started designing this file with one question. Why do people quit budget spreadsheets? I went looking in the formulas and they were not the problem. Most free templates calculate perfectly well.
The problem is the first session. A file gets downloaded, 25 tabs open, all of them empty, and a 40-minute video sits next to it. Someone starts typing category names, loses interest halfway, and closes the file. The next day they open it, see a half-finished sheet, and that is the last time it gets opened.
So the moment of abandonment is not February. It is minute 20 of the first session. Everything after that is just the consequence playing out.
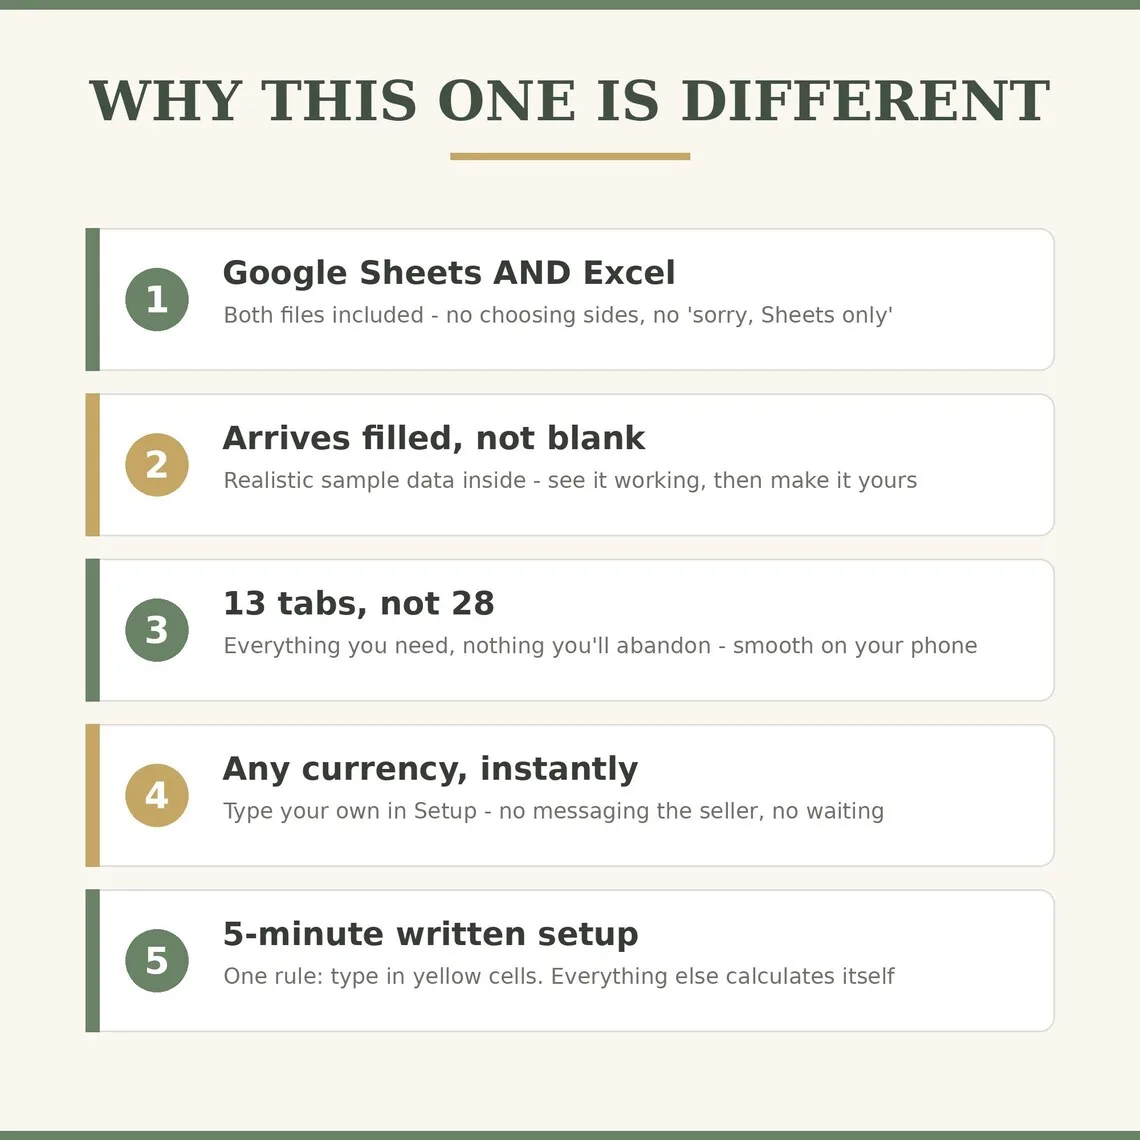
Once that was clear I inverted the design. The file does not arrive empty, it arrives filled with realistic sample data. Thirteen tabs instead of 28. No video, a five-step written setup instead. Editing a filled sheet is far easier than building an empty one.
Why 13 Tabs and Not 28?
The first version had 21 tabs. Investment tracking, vehicle costs, a pet budget, a holiday planner. Every one of them looked reasonable. Most testers never touched them and told me the file felt heavy.
So I cut by frequency of use. Any tab that would not be opened even once a year came out. Thirteen were left. The lighter file also opens smoothly on a phone, which directly affects whether transactions get entered at all.
Tab count is not a feature list, it is a cost. Every extra tab makes the user ask "am I supposed to fill this in too?" Ask that question often enough and the file closes.
Layer 1: Setup (once a year, 5 minutes)
The job of this layer is to lock down everything you will not touch again all year.
The Setup tab is filled in once. What you enter here runs behind every other tab. Do not start entering transactions before setup is finished, because a half-finished setup breaks every calculation downstream.
- 1Type your currency. The sheet works the same in dollars, pounds, euros or anything else, and the symbol updates everywhere.
- 2Enter the budget year. When the year changes, this is the only cell you touch.
- 3Pick your pay schedule: weekly, biweekly, semi-monthly or monthly.
- 4Build your category list. Delete what you do not use, rename the rest, add your own.
- 5Tag each category as a need, a want or future money. The 50/30/20 split reads from these tags.
- 6Enter recurring bills once: rent or mortgage, utilities, phone, insurance, subscriptions.
- 7Set each bill's frequency. A yearly insurance premium gets divided into its monthly equivalent automatically.
- 8Scroll the whole file once when you are done. If no yellow cell is left empty, you are set.
Layer 2: The monthly loop (10 minutes a month)
The job of this layer is to show you where the money went. Nothing more.
The monthly loop is three tabs: plan, transactions and dashboard. Write the plan at the start of the month, enter spending as it happens, look at the dashboard at the end. Add a fourth job and the system starts feeling like work.
- 1At the start of the month, assign an amount to every category. Assign all of your income.
- 2Get left-to-allocate down to zero. Zero does not mean the money is gone. It means every unit has a job.
- 3Enter spending with three columns: date, category, amount. Month and 50/30/20 type fill themselves.
- 4Do not batch it. Ten rows once a week beats 120 rows on the last day of the month.
- 5Check the dashboard once mid-month. Catching an overspent category on the 15th is useful. On the 31st it is history.
- 6If a category blew past its number, fix the number rather than blaming yourself. A wrong estimate is not a failed budget.
- 7At month end, look at planned versus actual. Write down the three biggest gaps.
- 8Build next month's plan around those three gaps. This is the loop that makes a budget realistic.
Layer 3: The yearly view (20 minutes every quarter)
The job of this layer is direction, not detail.
The annual tabs are not daily tabs. Open them once a quarter. Debt, savings and net worth barely move week to week, so checking them weekly only makes you feel stuck.
- 1Put all 12 months side by side on the annual dashboard. Expensive months only become visible here.
- 2Read your savings rate, not the amount saved. When income moves, the amount lies and the rate does not.
- 3Review the debt order. Snowball and avalanche sit next to each other. Pick one and commit.
- 4On savings goals, watch months-to-goal rather than the balance. Time remaining changes behaviour faster.
- 5Update net worth: assets minus liabilities. Four entries a year is plenty.
- 6Look at your real 50/30/20 split. Use it as a mirror, not as a rule.
- 7Check the no-spend counter. Seeing how many days you spent nothing shifts the habit on its own.
- 8At year end, make a copy, update the year in Setup and keep going in the same file.
Zero-Based Budgeting: Why "Left to Allocate: 0" Is the Target
One number sits at the top of the Budget Plan tab: left to allocate. The goal is to get it to zero. That reads backwards at first, because zero sounds like the money ran out.
But savings is a category. Debt payment is a category. When the number hits zero the money is still in your account, it just has an assignment. Money without an assignment gets spent around the 20th and nobody remembers on what.
This is also why saving whatever is left at month end does not work. At month end there is rarely anything left. Making savings a category at the start of the month, and automating the transfer on payday, turns the same income into a different result.

What Each of the 13 Tabs Does, and How Often It Opens
In a budget system the real question is not what a tab does but how often it needs opening. Three tabs that demand daily attention will sink the whole file. Here is the frequency map.
| Tab | What it does | How often |
|---|---|---|
| Start Here | Five-step written setup, fix-it tips and new-year instructions | Once a year |
| Setup | Currency, year, pay schedule and category list | Once a year |
| Recurring Bills | Each bill once, with its frequency. Monthly equivalent is automatic | Once a year, update on change |
| Budget Plan | Zero-based monthly allocation. Target: left to allocate 0 | Start of each month |
| Transactions | Date, category, amount. Month and 50/30/20 type fill themselves | Once a week |
| Monthly Dashboard | Planned versus actual for every category, for any month you pick | Mid-month and month end |
| Paycheck Planner | Safe-to-spend for each paycheck | Every payday |
| Annual Dashboard | All 12 months on one screen, plus your savings rate | Quarterly |
| Debt Payoff | Up to 20 debts, snowball and avalanche ordering automatic | Monthly |
| Savings Goals | Sinking funds with progress percentage and months to goal | Monthly |
| Net Worth | Assets minus liabilities | Quarterly |
| 50/30/20 | Needs, wants and future, sorted from your transactions | Look at month end |
| No-Spend Tracker | A counter for days you spent nothing | Daily, optional |
Debt Payoff: Snowball or Avalanche?
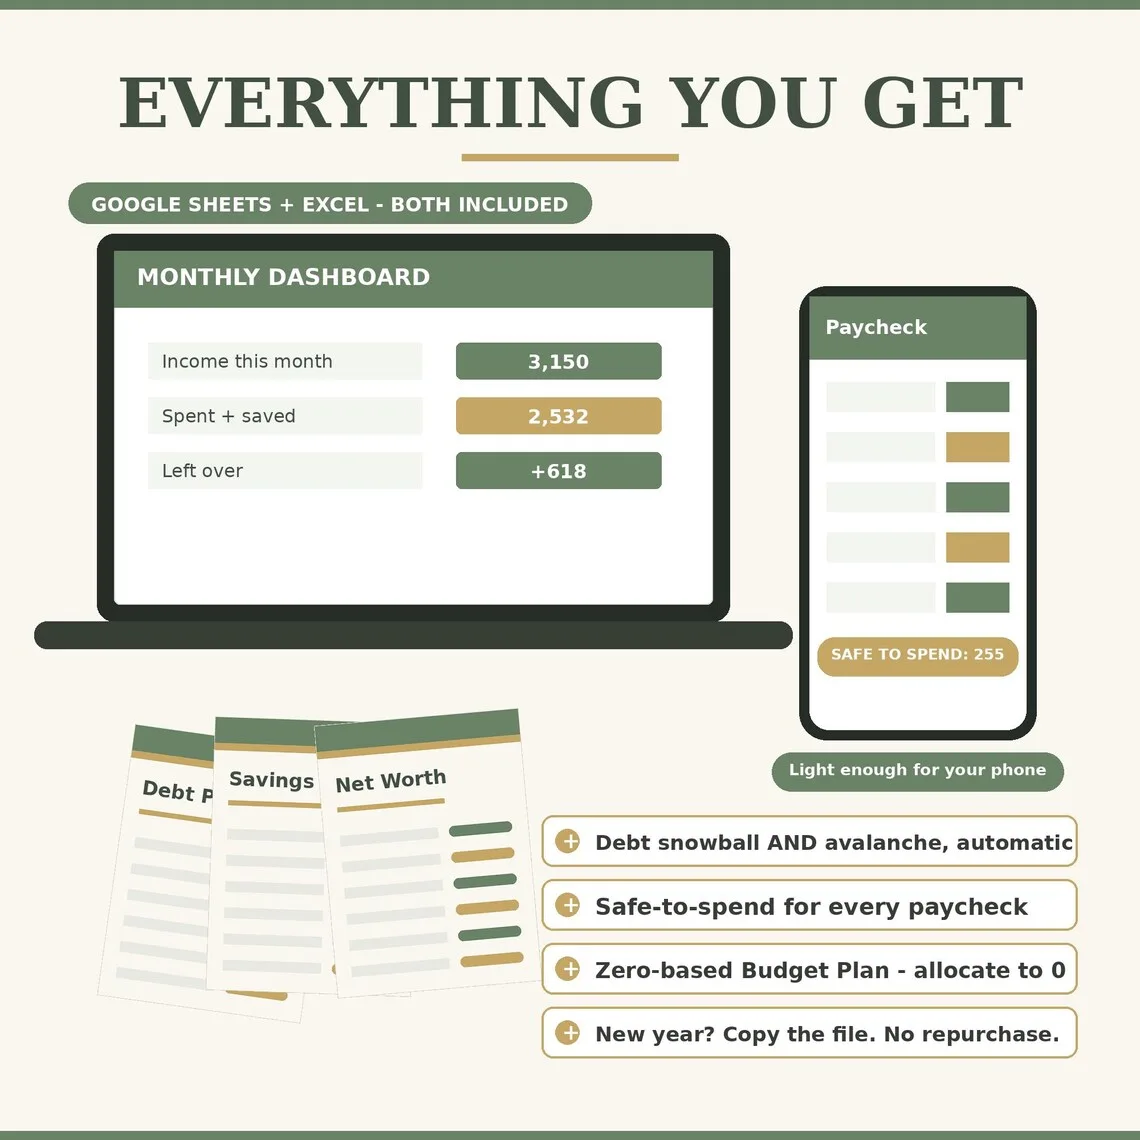
The debt tab takes up to 20 debts and produces both orderings at once. Snowball sorts by remaining balance, smallest first. Avalanche starts with the highest interest rate.
I put them side by side on purpose. Which method is better depends on the person, and arguing about it in the abstract goes nowhere. Maths favours avalanche. Completion rates favour snowball. Seeing both makes the decision concrete, because you can read the total interest difference instead of guessing at it.
A practical rule: if the gap is small, take snowball, because you will keep going. If the gap is large, take avalanche, because that money is worth holding on for. Decide from the two numbers, not from how you feel about debt.
The Paycheck Planner Is for the Week After Payday
Even with a correct monthly budget, the days right after payday are their own problem. The full amount is sitting in the account and that figure is not what you can actually spend. Rent has not left yet, the bills have not landed, savings has not moved.
The Paycheck Planner closes that gap. You enter the pay amount, the obligations due in that period and savings come off automatically, and one number is left: what is safe to spend until the next paycheck.
It handles weekly, biweekly, semi-monthly and monthly schedules. On biweekly pay it also makes the two three-paycheck months of the year visible in advance, which is the difference between assigning that money and spending it by accident.

How the System Became a File
All three layers live in one file. It works in Google Sheets and in Excel, so there is no side to choose. After purchase you get the .xlsx file immediately.

Six decisions that shaped the design
- It arrives filled, not blank. Realistic sample data is already inside. You see how it behaves first, then replace it with your numbers.
- Thirteen tabs. Anything that would not be opened once a year did not make the cut.
- One rule. Type in yellow cells, everything else calculates itself. That single rule removes the deleted-formula accident.
- Any currency. You type your own in Setup. No waiting on a custom version.
- Written setup. Five steps, no video. Reading it takes less time than watching one.
- Forgiving structure. Add categories, rename them, start in any month, skip a few weeks. Nothing breaks.
Why it ships with sample data
The first version was empty. Every tester asked the same thing: what goes here? A blank cell makes you guess both the format and the content. Once sample data went in, that question disappeared. By the time someone types their own number, they have already seen where it flows.
How it works
- The .xlsx file downloads instantly after purchase.
- For Excel, open it directly. Excel 2016 and later, Microsoft 365 and Excel for Mac are supported.
- For Google Sheets, upload the file to Google Drive, open it, then choose File and Save as Google Sheets.
- Follow the five steps on the Start Here tab.
- Type in yellow cells only.
Where to find the spreadsheet
It is an instant digital download, nothing ships. One file covers both Google Sheets and Excel, and there is no repurchase next year. Current price and tab previews are on the listing.
Build It Yourself: The Four-Tab Version
You do not need to buy anything. The backbone of this system fits into four tabs. Open a blank Google Sheets file and work through them in order.
1. Setup tab
Three blocks. First: currency, budget year, pay schedule. Second: category list with a type column (need, want, future). Third: recurring bills with amount and frequency. Make frequency a dropdown with weekly, biweekly, monthly, quarterly and yearly, and calculate the monthly equivalent with a formula.
2. Monthly plan tab
Columns: category, planned, actual, difference. Pull actual from the transactions tab with SUMIFS rather than typing it. Put two cells at the top: total income and left to allocate, where left to allocate is income minus the sum of planned. Getting that second cell to zero is the whole exercise.
3. Transactions tab
Columns: date, category, amount, month, type. Make category a dropdown bound to the setup list. Derive month from the date with TEXT. Pull type from the category list with VLOOKUP. Those three automations bring entry time down to a few seconds a row, which is what keeps the habit alive.
4. Debt tab
Columns: creditor, remaining balance, minimum payment, interest rate, snowball rank, avalanche rank. Generate both ranks with RANK: one ascending on balance, one descending on rate. Pay extra on your chosen top row and the minimum on everything else. When one clears, roll its payment into the next.
Those four tabs cover daily use. The annual dashboard, paycheck planner, net worth and the 50/30/20 split need extra formula work. If you would rather not write them, the ready-made version hands you that part built.
Four Things That Quietly Break a Budget Spreadsheet
These four come up regardless of the template. They do not throw errors, they just make the numbers drift until the file stops matching reality.
1. Your statement cycle is not the calendar month
If your card closes on the 15th, something bought on 20 March lands on the April statement. Enter spending by the date it happened, not by when the statement shows it, and do not also log the card payment as an expense. Otherwise the same money appears twice in the same file.
2. Annual bills wreck the month they land in
Car insurance, road tax, an annual software renewal. Paid in full they turn one month red for no real reason. That is what sinking funds are for: divide the annual amount by twelve, set it aside monthly, and the bill becomes a non-event when it arrives.
3. Variable income breaks fixed plans
Freelance and commission income does not fit a plan built on one number. Budget from your lowest month of the last six, not the average. Anything above that goes to a sinking fund or a debt line the moment it arrives, before it gets absorbed into normal spending.
4. Subscriptions are tied to a card, not to your attention
Subscriptions renew silently and only surface when a card expires. Listing them on the recurring bills tab is the point: you cannot cancel a cost you never see. Read the list top to bottom once a year and mark what you no longer use.
Five Habits That End With the File Closed
These were the most repeated mistakes during testing. All five are made with good intentions, and all five end the same way.
- Saving up transaction entry for month end. Nobody wants to type 120 rows in one sitting. Ten rows a week keeps it to five minutes.
- Planning the first month too optimistically. Set the numbers below reality and every category turns red by the 15th. Use the last three months of actual spending for month one, then tighten from month two.
- Running more than 20 categories. Too many categories create hesitation at entry time. Ten to twelve covers most households.
- Tracking to the cent. Rounding does not damage the conclusion, and it noticeably raises the odds you keep tracking at all.
- Starting over after missing a week. The file works fine with a gap in it. Leave the missed week empty and carry on from today.
The Three Layers in Short
Step 1: Layer 1: Setup (once a year, 5 minutes)
The job of this layer is to lock down everything you will not touch again all year. The Setup tab is filled in once. What you enter here runs behind every other tab. Do not start entering transactions before setup is finished, because a half-finished setup breaks every calculation downstream.
Step 2: Layer 2: The monthly loop (10 minutes a month)
The job of this layer is to show you where the money went. Nothing more. The monthly loop is three tabs: plan, transactions and dashboard. Write the plan at the start of the month, enter spending as it happens, look at the dashboard at the end. Add a fourth job and the system starts feeling like work.
Step 3: Layer 3: The yearly view (20 minutes every quarter)
The job of this layer is direction, not detail. The annual tabs are not daily tabs. Open them once a quarter. Debt, savings and net worth barely move week to week, so checking them weekly only makes you feel stuck.
Frequently Asked Questions
What is an annual budget spreadsheet and how is it different from a monthly one?
Why do most budget spreadsheets get abandoned by February?
Should I use Google Sheets or Excel?
What does zero-based budgeting actually mean?
Does the 50/30/20 rule still work?
Snowball or avalanche for paying off debt?
I get paid monthly. Is the paycheck planner still useful?
How do I handle a three-paycheck month on biweekly pay?
Can I start mid-year?
Can I change the currency?
Does it work on a phone?
Do I have to buy it again next year?
Could I build this myself?
Related Reading
The First 90 Days After Divorce: A Financial Plan With an Actual Order
If you are running your money alone for the first time, the budget is step two. Step one is an inventory of every account with your name on it.
In Short
A good budget spreadsheet is not the one with the most features. It is the one still being opened in month nine. Every design decision here answers a single question: does this make the file more likely to be opened, or less?
What you can do today is small. Open a blank file and list your recurring bills. Rent, utilities, phone, insurance, subscriptions. Even ten rows tells you your fixed monthly cost, and everything else in the system is built on that number.
Three numbers to track: total fixed monthly cost, savings rate and total debt balance. Write all three down today and again in three months. The difference is your progress.
Author: Luna Intim x HerRescueKits
Last updated: 27 July 2026
Next review: January 2027